To properly debug a website you need the right web debugging tools and an understanding of debugging basics. We\u2019ll show you how to get started in web design debugging so you can have a beautiful site in no time.
Debugging as a design concept can be defined as "a methodical process of finding and reducing the number of bugs". But the goal isn't necessarily to find problems, but to find where the problems are originating from.
What to Address When Web Design Debugging
-
Code Accuracy
-
Microdata
-
Performance
Crucial Web Debugging Tools
What you're simply doing is really "reverse engineering" the code. By looking at what your output and working backwards (to see where it's coming from) and adjusting accordingly. Outside of an understanding of code, the best tool for debugging is a quality inspector because that allows you to identify the problem.
Firebug for Firefox

Firebug integrates tightly with Firefox to offer a wealth of web development tools at any developers fingertips. While you browse you can inspect, edit, debug, and monitor all the CSS, HTML, and JavaScript that make a web page tick. While using Firebug all these options are in your hands...
- Inspect HTML and modify style and layout in real-time
- Use the most advanced JavaScript debugger available for any browser
- Accurately analyze network usage and performance
- Extend Firebug and add features to make Firebug even more powerful
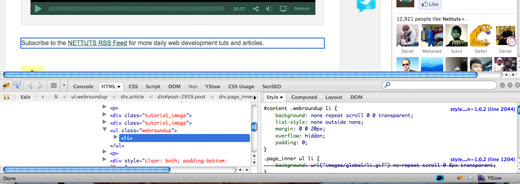
Firebug floats at the bottom of your browser and allows you to highlight specific elements and address the code that is creating the particular element. The blue box at the top of the screen is what my mouse was hovering over. The bottom left shows a macro view of the code... You will notice that the specific text is a line "<li>" and the bottom right box gives the css for that line. The real beauty is the ability to type in the bottom right box to play with some "what-if's". A simple example would be, "how would it look if I made the text gray?". That is as simple as typing color, hitting tab, and typing #999. Firebug is one of those tools that is absolutely necessary to produce clean, aesthetically pleasing sites... but as with anything in technology, I know people who have gone through years of coding without even realizing it exists. If you've never heard of it, don't feel dumb... but don't resist downloading it immediately to make you life incredibly easier.
-
Safari & Chrome’s Web Inspector
You need to enable the web inspectors that already exists in Safari and Chrome, but they are very easy:
- Safari: open the preferences, check the “Show Develop menu in the menu bar” item
- Chrome: open the preferences, check the “Show Page and Tools menus” item
These inspectors allow you to see the code that any specific page is rendering. It does not allow you the ability to delve deeper into individual elements. One tool that does assist in that thought is basically a stripped down version of firebug for safari, called safari lite.
-
Firebug Lite
If you'd like a minimal debugging application, Firebig offers a lite version of it's debugging app. It doesn't allow the detail of the Firefox add-on, but it is available on almost every major browser.
- Compatible with all major browsers: IE6+, Firefox, Opera, Safari and Chrome
- Same look and feel as Firebug
- Inspect HTML and modify style in real-time
- Powerful console logging functions
- Firebug Lite can be downloaded with the link below
If you have any other ideas (or kind comments), please feel free to leave them below. Thanks for stopping by - now get back to work.


